Forecasting presidential elections can be difficult. Witness the 2016 contest. On Election Day, Nate Silver’s 538 model projected a convincing Hillary Clinton victory – a 72% chance she would defeat Donald Trump. The New York Times estimated an even higher probability, calculating an 89% chance the Democrat would win. Larry Sabato’s Crystal Ball estimated a strong Electoral College triumph for Clinton at 322 to Trump’s 216. Nearly all academic forecasters and media organizations called it for Clinton.
What happened?
Its’ not just one accurate prediction that forecasters must deliver, but several are required to determine the winner.
First, analysts must predict the distribution of voter preferences – what percentage of the vote will candidates garner? If there is a large group of undecided voters, this obviously makes for a more uncertain outcome – see table 12.5% were undecided in 2016.
Where do those undecided voters live? Are they scattered uniformly across the United States or dis-proportionally in battleground states? Location matters.
Recall, the national popular vote does not decide the winner. Rather, it’s the first candidate to 270 Electoral College votes. State polls are therefore essential to forecasting presidential races.
How will the undecideds vote? Will they break equally for both candidates, or will they lean heavily in favor of one? In retrospect, a significant percentage broke late for Trump in 2016.
The Final National Polling Average for Recent Elections – 2016 higher % of undecided.
| Year | estimated vote for Dem | estimated vote for Rep | Undecideds |
| 2000 | Gore 43.6% | Bush 46.8% | 9.6% |
| 2004 | Kerry 47.4 | Bush 48.9 | 3.7 |
| 2008 | Obama 52.1 | McCain 44.5 | 3.4 |
| 2012 | Obama 48.8 | Romney 48.1 | 3.1 |
| 2016 | Clinton 45.7 | Trump 41.8 | 12.5 |
Second, and more problematic, analysts must correctly assess who will vote. There are over 230 million eligible adults. The question is which ones will show up on Election Day.
Some polling organizations sample registered voters only, thinking since they had already registered to vote the likelihood of voting is high. However, data shows many registered voters do not participate.
Other organizations use survey questions to form an index of a “likely voter”. For example, they first ask if the person is registered; then, whether they plan on voting. Such indices do have significant predictive power, separating likely from unlikely voters.
Despite these efforts, in 2016 polls underestimated turnout among demographic groups that disproportionally supported Trump (non-college educated whites) and overestimated turnout among groups that favored Clinton (Black Americans).
Third, state polls are much less reliable than national surveys – survey organizations typically do not invest resources for state polling. Accordingly, state polls are infrequent, and the results are subject to less scrutiny.
In 2016, key swing state surveys in Michigan, Wisconsin and Pennsylvania included a disproportionate number of educated voters – voters who overwhelmingly supported Clinton. The polling firms failed to account for this bias – they did not properly weight the survey sample based on respondents’ education levels. In other words, the survey sample did not match the voter population on a key characteristic – educational attainment.
In the past, education was not a variable consistently related to candidate preference. Today, education is strongly correlated with support for Democrats and the tendency to answer polling questions. The failure to adjust for education in state polls thus led to systematic underestimation of Trump’s strength among the least educated.
Group Think – a fourth issue
In addition to these 3 critical polling issues, forecasters must be aware of warning signs that challenge conventional wisdom and that threaten their own predictions.
As it turned out, the national polls in 2016 were largely correct. Hillary Clinton won the popular vote by a couple percentage points – as expected. Yet a 2% advantage in the popular vote is a close contest. In several battleground pre-election state polls, Clinton’s lead was in fact within the margin of error. To close to call.
However, many analysts and media figures ignored the evidence. Weeks before Election Day, major news and polling organizations portrayed the race as effectively over – even though a large percent of voters remained undecided and battleground states were closely contested.
It seems the biggest problem in 2016 was not the polls – as they accurately projected a close race. Rather, a significant problem was the people that analyzed and commented on them.
To his credit, Nate Silver at 538 acknowledged his own errors and blamed groupthink.
He argued that political journalists and analysts are a homogenous class: Most possessed advanced degrees, lived largely in Washington DC, New York, and other major metropolitan areas, and voted Democrat. In addition, the group did not reside in the swing states or understand rural America – precisely those places that produced unexpected support for Trump. Finally, no one this group knew, worked with, and discussed politics with, believed Trump had a chance.
In short, the vast majority of political journalists and election analysts read the polling data in ways that reproduced their mindset. The irony is that the group often scolded “ordinary” American’s for living in self-serving information bubbles. Yet on Election Day, it was the media’s bubble that burst.
Implications
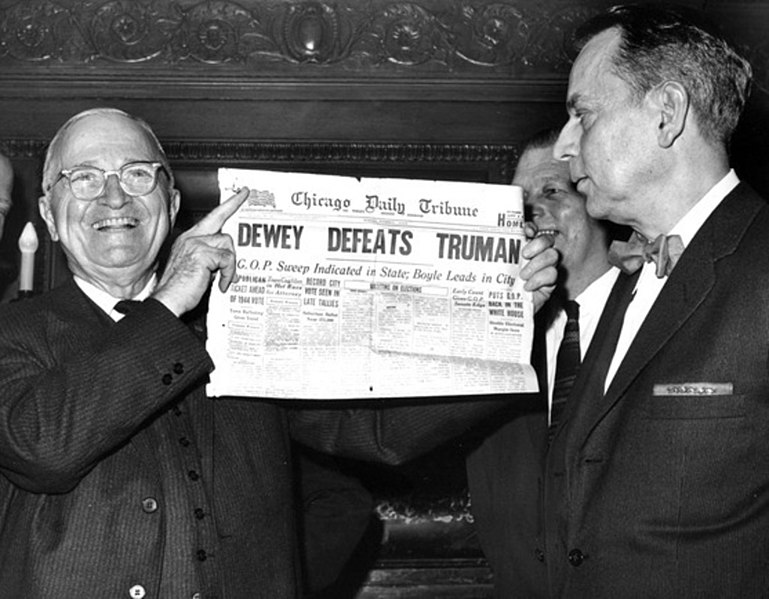
The most famous polling error in American history is captured by the image of a delighted Harry S. Truman holding aloft the Chicago Daily Tribune whose headline read, Dewy Defeats Truman. It was a major blunder, a devastating mistake that damaged the reputation of polling firms across America. The polling industry was certain Dewy would win.
Just like in 2016, the 1948 election aftermath produced several explanations for the inaccurate forecast. They are familiar. The number of undecideds broke for Truman not Dewy. Among likely voters, Dewy supporters were overrepresented and Truman voters underrepresented.
These were not technical problems, but errors in judgment – judgments influenced by a strong consensus about who would win.
The good news for 2020 forecasting:
- There are many more battle ground polls.
- According to some surveys, the number of undecideds is about half of what is was at this time four years ago.
- While expert consensus again supports a strong Democrat victory, most journalists and pollsters appear wary and relatively guarded about strident predictions.
Together, these circumstances favor accurate forecasts.
Now the bad news – 2020 is a different kind of election.
- The election takes place during a global pandemic that has killed thousands of Americans.
- The election takes place during an economic downturn not witnessed in decades.
- The election takes place during widespread protests for racial justice.
Together, these circumstances make forecasts more uncertain. Who will voters blame for the economy, for racial discord, and who will be the likely voters in a pandemic?
Regardless, the forecasting industry must get it right. They cannot afford another blunder.

Mark a really good blog perhaps the best yet. The question that stands there is why did the undecided go Trump? One explanation: late events push one way or the other. The Commely FBI announcement the week before election might have been important. It should be interesting rather win or lose where will all the never Trumpers go. I would expect if Biden wins several Republicans will be in the cabinet. If Trump wins I don’t expect military in important positions. Great job Mark
Sent from my iPhone
>
LikeLike
Thanks…..yes, several of the forecasters suggested the late surge of undecideds went for Trump because of the James Comey letter announcing a reopening of the FBI probe into Hillary Clinton use of private email server, etc. Though it is speculation – what is often newsworthy and important in DC is not necessarily important to undecideds.
LikeLike
I recall an academic forecaster in 2016 noting that his algorithm had the incumbent party losing the election. He went on to say that the Trump campaign was so unorthodox that he second guessed his model and predicted Clinton, instead. I heard the Jill Lepore podcast (The Last Archive – Project X) and it got me thinking of that prediction in 2016.
LikeLike
Hey Alex, yes, everything about 2016 was unorthodox! I do think the Silver’s idea of “group think” played a significant role in why everyone seemed to miss/discount Trump campaign and overestimate the support of Clinton — at least in the key Midwest swing states. But, the evidence was there, right in front of everyone, that the race was close and the # of undecideds unusually high. Thanks for tip on podcast, will check that out.
LikeLike