Data from Financial Times
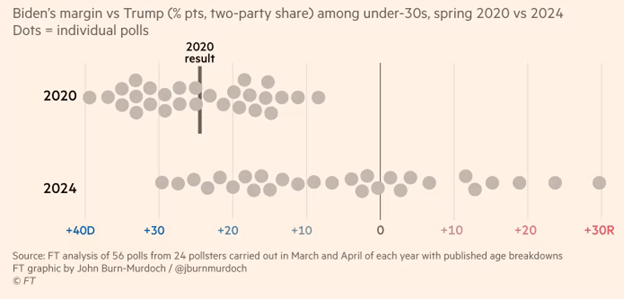
The figure below demonstrates variation in polls that survey young voters’ choices for president. The dots represent different polls published during a given period in 2020 and 2024.
In 2020, the polls showed a clear lead for Joe Biden – to the left of the zero vertical line. That lead varied from +40 to just under +9. The average of all poll results was close to the actual 2020 election outcome of +25.
However, in 2024, poll results are scattered nearly the entire length of the horizontal axis. Some polls show Biden leading by +30, others show Trump up by +30.
What’s going on?
There are more polling firms than in the past, and they are deploying different methodologies – which produce vastly different results.
In other words, it’s methodological differences that are driving the results, not large swings in youth voting preferences.
The next figure shows how results change according to polling method – the number of respondents in the samples remain the same however.
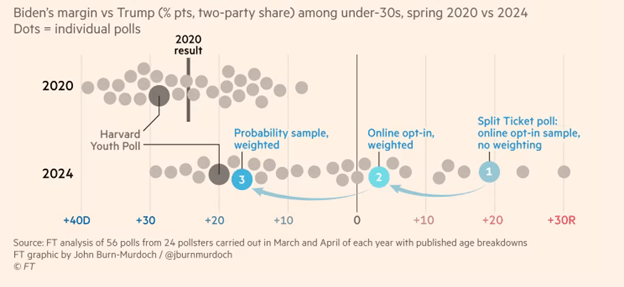
Using an online sample with no weights, Trump is ahead by +20 – far right on graph (identified as 1). However, when the online poll is weighted – a statistical technique that adjusts the sample to be more representative of the population, Trump’s lead drops to approximately 4 points (identified as 2).
Finally, deploying a traditional probability weighted sample Biden’s lead jumps to nearly 20 points (identified as 3).
All three techniques are commonly used by polling firms.
Obviously, not a good look for the polling industry.
The Harvard Youth poll did a pretty good job in 2020 of predicting the youth vote – and it utilizes the very best methodology – very large probability samples of 18-29 year olds. The Harvard result in 2024 would likely be the best estimate of youth voting preferences. As of today Biden +20.
What to do?
Several reputable news organizations publish pollster ratings or scorecards – 538 and Real Clear Politics.
From the lists, pick a polling firm, or two, based on superior ratings – or lowest prediction errors – and ignore the rest. Then track the poll results overtime to assess the presidential race.
This is a reasonable way to identify quality polling firms – though on occasion even the top ranked firms get things wrong (2016 presidential contest-especially state level polls).
